Children with Disabilities are More Likely to be Out of School
Share
24/04/2017
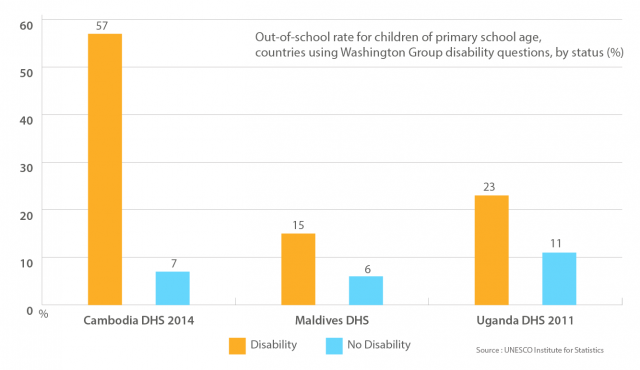
This chart examines attendance rates disaggregated by disability status based on data from Demographic and Health Surveys that applied the questions recommended by the Washington Group

Children and adolescents with disabilities are more likely to be out of school or to leave school before completing primary education
Under the banner of accountable and participatory governance for delivering on Sustainable Development Goal (SDG) 4, Global Action Week for Education calls for citizen participation in education policymaking and monitoring progress.
At its core, SDG 4 is about equity and inclusion. Yet, the lack of reliable data about marginalised groups, such as disabled children, poses a major barrier to policy, legislation and advocacy for inclusive education.
Part of the problem is the lack of consistent concepts, definitions and indicators on disability, combined with differences in how the data are collected.
To address this problem, more surveys are drawing on the methodology developed by the Washington Group on Disability Statistics (WG), which measures individual “functioning” across different dimensions.
A new UIS fact sheet on “Education and Disability” presents data from Cambodia (2014), Maldives (2009) and Uganda (2011) collected through household surveys which included the set of internationally-comparable WG questions.
The chart indicates the proportion of children of primary school age who are not attending primary or secondary school. In all three countries, children with a disability are more likely to be excluded from education.
The most striking gap is in Cambodia, with a 50 percentage point difference between the out-of-school rate of disabled and non-disabled children (57% vs. 7%). In other words, 1 in 2 Cambodian children with a disability is not in school, compared to 1 in 14 children without a disability.
Out-of-school rates for disabled adolescents is four times that of non-disabled adolescents (13% vs 3%) in Maldives, whereas in Uganda, rates are almost twice as high (33% vs 17%).
Not only do children and adolescents with a disability have lower school attendance rates, they are also less likely to complete primary or secondary education compared to their peers not reporting a disability.
Similar patterns are observed in countries which do not use the WG questions to measure disability, but these data are not comparable. The availability of internationally-comparable data on the situation of people living with disabilities will increase as more countries adopt the WG questionnaire.
In the meantime, to ensure continuous improvement of the knowledge base for monitoring SDG 4, in particular its equity component, the UIS has integrated disability as a standard dimension of disaggregation into its process of indicator production from household survey data, while adhering to strict international standards to ensure reliability and cross-country comparability.
The UIS is also working with partners to harmonise the definition, calculation and disaggregation of indicators, for example through the Inter-Agency Group on Education Inequality Indicators (IAG-EII) that was established in 2016.