
As governments pursue Sustainable Development Goal 4 (SDG 4) on education, with its strong focus on equity, are they embedding equity at the very heart of their national education plans? Recent research suggests that, in many cases, the answer is no, but it also highlights ‘honorable exceptions’: countries that are tracking equity in access to education and in learning.
In the Handbook on Measuring Equity in Education, published earlier this year by the UNESCO Institute for Statistics (UIS), we explored how well equity is captured by indicators in today’s national education plans – the main tool used by governments to plan and implement education policy. Our aim is to offer guidance for policymakers when selecting indicators and help them track progress.
Still not enough data to measure equity
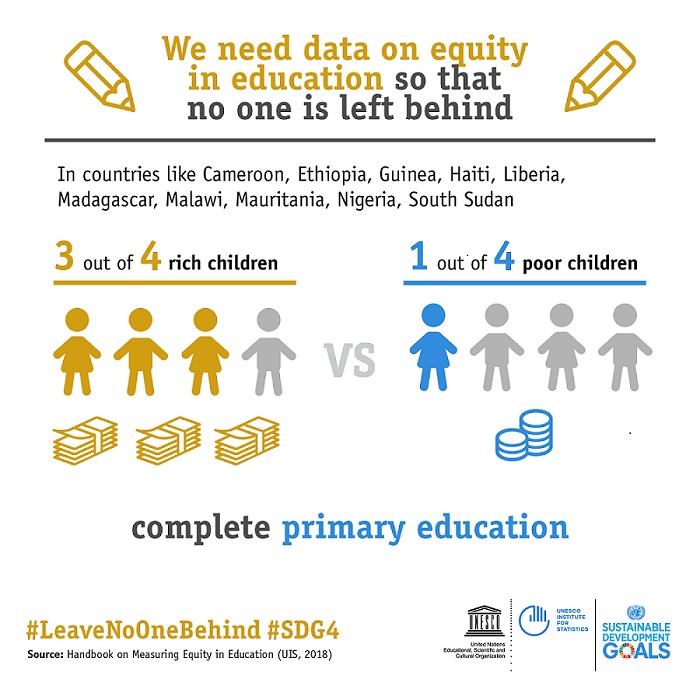
We scrutinised national education plans for 75 countries, across every region, looking at both access and learning. The results were sobering, strengthening the case for far more data on far more issues, and from the earliest years. They also reveal positive examples from countries that are pushing hard to get the data they need and that offer lessons for others to follow.
On access, the most commonplace indicators to track progress relate to participation and completion at each education level, often disaggregated by sex, but there are few that propose disaggregation by location, income levels, ethnicity or disability. There is little or nothing on school drop-out or children who repeat grades, and few national plans track the number of children out of school.
A notable exception is Somalia, with a national education plan that includes measures to disaggregate enrolment information not only by sex, but also by disability, special needs and location. Because Somalia has measured some of these indicators in the past, it has that precious resource – a baseline – that allows it to produce more accurate targets.
On learning, the lack of indicators stipulated in national education plans is striking, and where they are found, they make little reference to equity. Only 28 of the 75 countries have any indicator for learning in the upper grades of primary education, and of these just 5 have indicators for equity in learning at this level. Only 23 of the 75 plans reviewed include indicators for learning at earlier grades of primary school, even though tracking progress from an early stage is vital to ensure that disparities are tackled well before they become more difficult and costly to resolve. What’s more, of these 23 plans, only 4 include equity dimensions.
Here, the honorable exception is Ethiopia. Its 2015 national plan tracks progress on standardised examinations in different grades, measures learning achievement and sets equity targets by disaggregating measures for boys and girls for the “percentage of students who achieve 50% and above (composite score) in the National Learning Assessment (NLA)”, for students in Grades 4, 8, 10 and 12 separately. Ethiopia also has that all-important baseline (25% of students achieving 50% and above in the composite score in the NLA in 2012), which allows the government to set realistic targets to improve learning over time: 50% of boys and girls achieving 50% and above in the NLA in Grades 4 and 8 by 2017, and 50% achieving 50% and above in Grades 10 and 12 by 2019.
Tracking equity data is even more limited at the secondary level
At the secondary level, only 20 of the 75 countries track learning, and only Ethiopia, Mexico and Somalia disaggregate learning by any dimension of equity – in this case, sex.
Most countries that include indicators for learning at the secondary level cover mathematics and reading in the main national language or languages (in cases when two or more languages are spoken). Malaysia and Samoa are exceptions, which include English as a foreign language, as are Guyana and Niger, which cover science in national examinations. Once again, Ethiopia is forging ahead, including physics, biology and chemistry in its national learning assessment.
Our review of indicators to track equity in access and learning confirm that much more can – and should – be done to improve education indicators on equity, and particularly to ensure greater visibility for the most disadvantaged children. The findings suggest three key strands for policy action on data to track equity in education.
First, we need data on an expanded range of disadvantage.
We need data on children’s socioeconomic situation, and on their disability, geographic, ethnic and linguistic characteristics, as well as their gender.
Measuring socioeconomic status is not easy, but is possible. The wealth index, for example, records the ownership of household goods, housing characteristics and access to household services to compute the relative wealth of each household. Education authorities can tap into such household surveys to enhance their information on students and link this information to educational access, progress and completion. There has also been progress on linking children’s background information to learning by using data from the Young Lives international research project or citizen-led assessments from the People’s Action for Learning (PAL) Network.
Measuring equity by location, particularly at the regional level, should usually be more straightforward. Most education management information systems (EMIS) datasets have information about school resources and their location, making it possible to gather refined information about clusters of indicators on, for example, the educational backgrounds of teachers by sub-region. National data on the locations where students take exams offers a good proxy for the location where they live. Such information enables analysis of regional gaps in learning.
Measuring equity by ethnicity is possible, but can be sensitive and politically charged. In some instances, proxies can be used, such as location or language.
Measuring equity by disability is critical, given the invisibility of children with disabilities in most datasets. Important progress has been made here, through international initiatives to rephrase survey questions that focus on the difficulties children face in accessing services, rather than on their disability. The questions developed by the Washington Group on Disability Statistics to identify these functional limitations provide a simple, sensitive and nuanced way to capture disability, even in contexts where there are concerns that stigma could prevent direct reporting. In Pakistan, for example, the Annual Status of Education Report (ASER) in 2015 drew on questions developed by the Washington Group to reveal that children with disabilities are likely to be among the most disadvantaged in education.
Second, we need to expand the coverage of data collection.
If we need data on a broader range of disadvantages, what do we need to do differently? One thing is certain: we can’t get an accurate picture of learning without including children who are out of school – often the most disadvantaged. So we need complementary sources of data, such as the sample-based PAL Network citizen-led surveys, the Demographic and Health Surveys (DHS) and other household surveys that enable the collection of data on the background characteristics of children and their households. Data collection by local citizens with contextual knowledge makes such surveys particularly apt for data gathering on children.
Third, we need to focus explicitly on the most disadvantaged children from the earliest years.
The Education 2030 Framework for Action accompanying the SDGs acknowledges that “no education target should be considered met unless it is met by all.” So data analysis must focus on the most disadvantaged. One option is to set ‘stepping stone’ interim targets to cater for the different rates of progress needed for different sub-groups within countries.
Tracking also needs to start in the early years when inequities begin to bite: according to Young Lives data, in Ethiopia, India (Andhra Pradesh), Peru and Viet Nam, children from the richest 25% of the population make more progress than those from the poorest 25% in mathematics between ages 5 and 8. Data analysis needs to inform practice, rather than simply describing the state of affairs once it is too late and inequities have become entrenched.
Cross-sectoral efforts are crucial to remove all barriers to education
Policymakers need to consider how to bring the three strands together to reveal the intersections of disadvantage that deny a child’s right to a quality education. It is vital to look at the full spectrum of a child’s circumstances, whether in the classroom or beyond the school gates.
It might be possible to tackle some challenges through education policy alone, but other challenges require cross-sectoral efforts to remove barriers to education. Such efforts are vital if policies are to support the children who might otherwise be left behind.
In this series, read also:
Leave a comment