By Andrés Sandoval-Hernández, University of Bath, and Diego Carrasco, Pontificia Universidad Católica de Chile
When UN Member States adopted the 2030 Agenda and its 17 Sustainable Development Goals (SDGs), there was not much discussion about how these goals were going to be measured. As we enter the Decade of Action, deciding on a measurement strategy for all SDGs and their targets has become a pressing issue.
We live in very challenging times. The rapid influx of immigrants, refugees and asylum seekers, along with increasing intolerance, social exclusion and feelings of alienation, extremism among young people, and the ongoing climate crisis, pose complex challenges. To face this global environment, we need information that enables us to think critically, connect our actions with their impacts, and act as empowered, active global citizens.
When looking specifically at SDG 4 for education, Target 4.7 asks Member States to “ensure that all learners acquire the knowledge and skills needed to promote sustainable development, including, among others, through education for sustainable development and sustainable lifestyles, human rights, gender equality, promotion of a culture of peace and non-violence, global citizenship and appreciation of cultural diversity and of culture’s contribution to sustainable development.”
Today, the 60th anniversary of the UNESCO Convention against Discrimination in Education, we are reminded more than ever of the values of inclusion embodied in this target. While we say no to discrimination in education, let us say yes to inclusivity, respect for our differences and the right of all children to a quality education.
In this blog post we describe a recently developed strategy for assessing two indicators that embody tolerance, respect and sustainable development:
Indicator 4.7.4: Percentage of students by age group (or education level) showing adequate understanding of issues relating to global citizenship and sustainability.
Indicator 4.7.5: Percentage of 15-year-old students showing proficiency in knowledge of environmental science and geoscience.
Indicators 4.7.4 and 4.7.5 speak to empowering and enabling students to be active agents of positive change, while taking action to meet the other goals.
Using UNESCO Institute for Statistics (UIS) data, we are preparing an open-source, robust and easy-to-use document containing detailed technical guidelines for countries and other interested parties to collect the data necessary to produce the scales we discuss below.
Our measurement strategy is based on International Large-Scale Assessments (ILSAs) in education (Sandoval-Hernández, Isac, & Miranda, 2019; Sandoval-Hernández & Carrasco, 2020). In our view, ILSAs are a natural fit for assessing these particular thematic indicators because existing studies have already collected much of the relevant information. Our strategy includes a proposed conceptual framework, measurement models, a process to generate proficiency scores, and a method for establishing a threshold of ‘adequate’ and ‘satisfactory’ performance for Indicators 4.7.4 and 4.7.5, respectively.
This measurement strategy has been reviewed and endorsed by the UIS’ Technical Cooperation Group on the Indicators for SDG 4-Education 2030 (TCG), which is responsible for the development and maintenance of the thematic indicator framework for the follow-up and review of SDG 4. The scores are available on the UIS database.
We first identified a global content framework based on UIS data for defining and operationalizing Global Citizenship Education (GCED) and Education for Sustainable Development (ESD) (Hoskins, 2016; IBE, 2016). While there is no universal agreement on how to define or operationalize these concepts, it is possible to identify a set of guiding principles and themes.
We then carried out a mapping exercise to evaluate how to measure concepts in the framework using instruments and procedures of existing ILSAs. To do this, we identified the International Civic and Citizenship Study (ICCS) as the most valuable source of information for Indicator 4.7.4; and the Trends in Mathematics and Science Study (TIMSS) and the Programme for International Student Assessment (PISA) as the most informative for Indicator 4.7.5. These studies have the highest coverage of topics relevant to the SDGs, and a high potential to inform long-term monitoring. The results of this mapping exercise can be found here.
The analytical strategy to estimate the percentage of students who show ‘adequate’ and ‘satisfactory’ performance in each indicator had four main steps:
A list of the categories and sub-categories of scores produced for Indicator 4.7.4, and a description of student knowledge at the cut-off points are shown in Figure 1.
Figure 1. Categories and descriptions for SDG 4.7.4

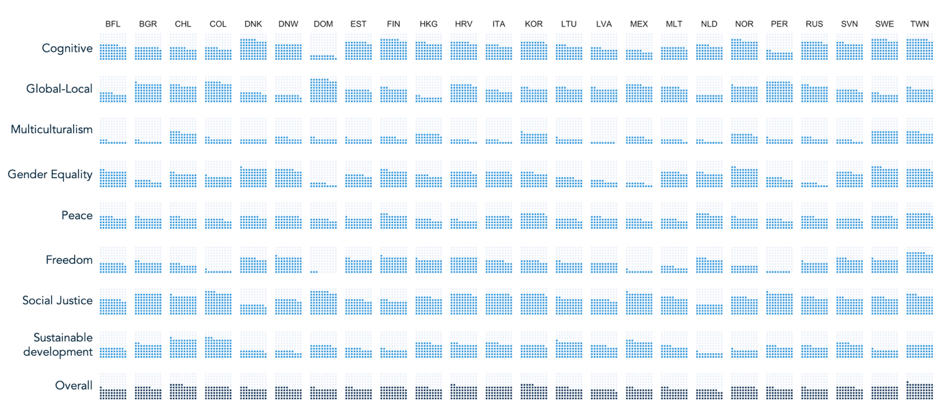
The percentage of students showing an ‘adequate’ understanding of issues related to global citizenship and sustainability (Indicator 4.7.4) – according to the scores and cut-off points – is shown in Figure 2. In this waffle plot, each square dot represents 1% of students reaching a certain standard (category or subcategory). As can be observed, there is an important variation in the proportion of students reaching the different standards both across countries and across standards. If we look at the cognitive standard, Latin American countries have lower proportions of students being able to make connections between processes related to global citizenship and sustainability and the legal and institutional mechanisms used to control them; while these proportions are generally higher in northern European and Asian countries (e.g. 19% and 32% in Dominican Republic and Peru vs 77% and 78% in Finland and Chinese Taipei). This pattern is, however, not constant. If we look at non-cognitive standards (i.e. attitudes and behaviours), we observe that, for example, in the category Social Justice, there are greater proportions of Latin American than European students highly endorsing the importance of participation in social movements (e.g. 87% in Dominican Republic vs 39% in Denmark). In any case, we think that rather than producing rankings, this data is much more useful at informing countries where they are, where plausible targets can be set and to inform the design of strategies to reach those targets. Furthermore, because these measures are comparable across countries, they offer the possibility of learning from each other by doing in-depth analysis of the social and political context associated with these measures. A full description of the thresholds used to set these standards and the items and methodology used to produce the respective scores can be consulted here.
Figure 2. Proportion of students reaching the SDG 4.7.4 standards in each country
As with global citizenship and sustainability, the results for Indicator 4.7.5 for environment science and geoscience, also show interesting variations both across countries and standards. A list of the categories and sub-categories for which scores were produce for Indicator 4.7.5 and a description of what students know or can do at the established cut-off points and are shown in Figure 3.
Figure 3. Categories and descriptions for SDG 4.7.5

The percentage of students showing ‘proficiency’ in environmental science and geoscience (Indicator 4.7.5) according to the scores and cut-off points is shown in Figure 4. As in Figure 2, each square dot represents 1% of students reaching a given standard.
When looking at the cognitive standard, Asian countries report the highest proportions of students who are able to apply and communicate concepts related to environmental science in everyday situations (e.g. Singapore, 59%). However, this pattern does not hold for the non-cognitive standards, where Botswanan and Kuwaiti students are the ones who report the highest enjoyment and confidence in learning science (51% and 39% respectively). Nevertheless, we insist that the real value of these measures is that given their reliability, relevance and timeliness, they can be used to inform the development of strategies to reach the targets included in Target 4.7. A full description of the thresholds used to set these standards and the items and methodology used to produce the respective scores can be consulted here.
Figure 4. Proportion of students reaching the SDG 4.7.5 standards in each country

Note: Data is presented for all countries for which data is available in TIMSS 2015. AAD= Abu Dhabi, UAE; ARM= Armenia; AUS= Australia; BHR= Bahrain; BWA= Botswana; ABA= Buenos Aires, Argentina; CAN= Canada; CHL= Chile; TWN= Chinese Taipei; ADU= Dubai, UAE; EGY= Egypt; ENG= England; GEO= Georgia; HKG= Hong Kong, SAR; HUN= Hungary; IRN= Iran, Islamic Rep. of; IRL= Ireland; ISR= Israel; ITA= Italy; JPN= Japan; JOR= Jordan; KAZ= Kazakhstan; KOR= Korea, Rep. of; KWT= Kuwait; LBN= Lebanon; LTU= Lithuania; MYS= Malaysia; MLT= Malta; MAR= Morocco; NZL= New Zealand; NOR= Norway; OMN= Oman; COT= Ontario, Canada; QAT= Qatar; CQU= Quebec, Canada; RUS= Russian Federation; SAU= Saudi Arabia; SGP= Singapore; SVN= Slovenia; ZAF= South Africa; SWE= Sweden; THA= Thailand; TUR= Turkey; ARE= United Arab Emirates; USA= United States.
We believe that studies like TIMSS, ICCS and PISA are well suited for providing at least a proxy measurement of Indicators 4.7.4 and 4.7.5. These ILSAs provide high coverage for the GCED and ESD themes, incorporate these topics naturally in their frameworks, collect comparable data consistently (allowing long-term monitoring), and have unrivalled data quality assurance mechanisms in place (ensuring data accuracy, validity and comparability).
It is, however, important to consider the limitations of this measurement strategy. For example, the data is confined to a specific level of education or student population (e.g. Grade 8 for ICCS and TIMSS; 15-year-old students for PISA). Another limitation is country coverage. The information available in the last cycles of TIMSS and ICCS allowed us to produce scores for 60 countries. While this is a significant number of countries, it is important to acknowledge that two-thirds of UN members do not participate in these studies.
Nevertheless, we believe that with a coordinated effort and support by all stakeholders, many more countries can collect the data for this measurement strategy so that we can work toward the elimination of discrimination in schools and create a more equal and just society.
Sources:
Global citizenship education: topics and learning objectives
Leave a comment