
Analysts working with SDG indicators on learning proficiency, in particular Indicator 4.1.1, would in many cases be familiar with a formula such as the following:
![]()
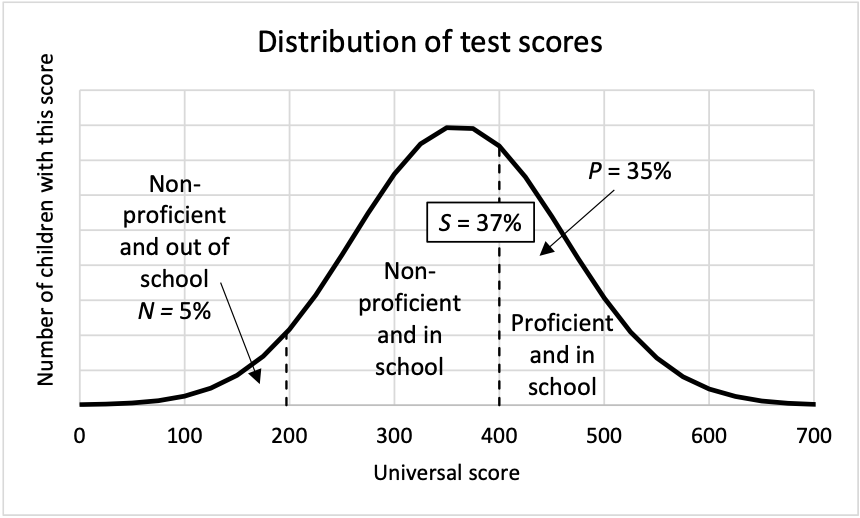
The percentage of enrolled learners who are proficient, S, is typically known from assessment results. The percentage of children of the age of the grade in question who are not enrolled, N, is typically known from household data. P is what planners are ultimately interested in: the percentage of the relevant age cohort in the population who are proficient. While there is some ambiguity over whether Indicator 4.1.1 refers to S or P, P is clearly important and must be monitored.
The above formula assumes that non-enrolled children do not reach minimum proficiency levels, following the approach taken in UIS (2020) and UIS (2017). The relationships can be illustrated as in the following graph, which is based loosely on levels of learning proficiency and the out-of-school problem in developing countries. Here P is a function of S and N, according to the above formula.
In the context of COVID-19, sudden declines in enrolment, meaning N rises, and declines in proficiency in the population due to disruptions in schools, meaning P drops, are possible. In examining the effects on the three statistics P, N and S, it is important to remember that N and S influence each other. Assuming that children who drop out of the schooling system are the academically weakest learners, an assumption that is likely to hold for a number of reasons, one can expect S either to rise or decline, depending on the magnitudes of the two effects: dropping out of school and learning losses. If one has estimates of P and N, then the new S is calculated according to the following transformation of the previous formula:

To illustrate the ambiguity, we can imagine learning losses resulting in a drop in P from the 35% seen in the graph to 33%. If out-of-school N increases from 5% to 9%, S declines from 37% to 36%. However, if N displays a larger increase, from 5% to 13%, then S displays an increase from 37% to 38%. Even with learning losses in the population of a specific age, if enough learners drop out, and we assume that these learners are those who struggled most academically, then assessment systems may in fact detect an increase in the percentage of proficient learners.
Clearly, planners need to be fully aware of these relationships. Above all, the first formula above should not be used to conclude that more out-of-school children on its own produces a decline in P. If S was 37% (as in the graph) and then out-of-school N increases from 5% to 13%, one cannot conclude that P drops to 32%. This would ignore the fact that if N changes, S automatically changes too.
Leave a comment