New UIS Data for SDG 9.5 on Research and Development (R&D)
Share
29/06/2020

Science, Technology and innovation (STI) has been increasingly recognised as fundamental to achieving economic and sustainable growth. Tackling some of the greatest challenges to achieve Sustainable Development Goals (SDG) – such as responding to climate change, improving health, etc. - could depend largely on harnessing STI. Nothing illustrates this better than the COVID-19 crisis and the collaborative initiatives globally to construct a vaccine and develop effective treatments. Amidst efforts to contain and limit the spread of this pandemic, the importance of increased investment in Research and Development (R&D) has never been more apparent.
As part of the SDG Agenda 2030, countries have pledged to “build resilient infrastructure, promote inclusive and sustainable industrialization and foster innovation”. In particular, SDG Target 9.5 calls upon them to “enhance scientific research, upgrade the technological capabilities of industrial sectors in all countries, in particular developing countries, including, by 2030, encouraging innovation and substantially increasing the number of research and development workers per 1 million people and public and private research and development spending”. Governments and policy makers supplied with reliable, comparable and timely available data on R&D will be better equipped to plan and monitor national R&D efforts – another important undertaking to strengthen in light of efforts to contain COVID-19 and any future crises.
The UIS, as the custodian agency, produces two key indicators to monitor progress towards this SDG target:
The Institute has published new data on the human and financial resources devoted to R&D. Data are available for 162 countries and territories. This release includes new country-level data for the reference year 2018 and time series data for the two global indicators. Figure 1 represents the ten countries reporting the highest R&D expenditure as a proportion of GDP .
Figure 1: R&D expenditure as a proportion of GDP: ten highest

When examining regional results, while the proportion of global GDP invested in R&D has increased from 1.62% in 2010 to 1.72% in 2017, there is a wide disparity between regions. Europe & North America, and Eastern & South-Eastern Asia spent 2.25% and 2.13% of GDP on R&D respectively whereas sub-Saharan Africa is at 0.38% and Northern Africa and Western Asia is at 0.81% (see Figure 2).
Figure 2: Regional trends on R&D expenditure as a proportion of GDP (2010 – 2017)

As there is no agreed/recommended global target against which the progress towards SDG 9.5.1 can be measured, it is instead assessed using the term “significant” progress/increase. However, regions and some countries have been setting their own spending targets for some time now. The most prominent is the European Union target to raise overall R&D investment to 3% of the GDP by 2020. Only five countries in Europe have reached this target at present: Switzerland (3.37%), Sweden (3.34%), Austria (3.17%), Germany (3.09%) and Denmark (3.06%). The African Union has set a target of 1% of GDP invested on R&D, but data available to the UIS show that only four sub-Saharan African countries are close to this target: South Africa, Kenya, Burkina Faso and Rwanda (around 0.8% – 0.7% in all four countries). With the notion of spending 1% of the GDP on R&D, which has often been used as a target in some developing countries, it is interesting to note the top investors in other developing regions (see Figure 3). In Latin America & the Caribbean, Brazil reports the highest level of R&D investment (1.26%), followed by Argentina, Uruguay, Ecuador, Costa Rica and Chile (around 0.5% - 0.4%). In Central & Southern Asia, Iran stands at 0.83% followed by India (0.65%), whereas Singapore (1.94%), Malaysia (1.44%) and Thailand (1.00%) are the leaders in South-Eastern Asia. In Northern Africa, Egypt is at the top of the list (0.72%), while Israel (4.95%) and United Arab Emirates (1.30%) are leading in Western Asia. On the other hand, in other industrialized regions, aside from the Republic of Korea (4.81%) and Japan (3.26%) that lead , China (2.19%) is reaching the towards the average in Eastern Asia. In North America, the United States and Canada spent 2.84% and 1.57% of GDP on R&D respectively.
Figure 3. R&D expenditure as a proportion of GDP, latest year available
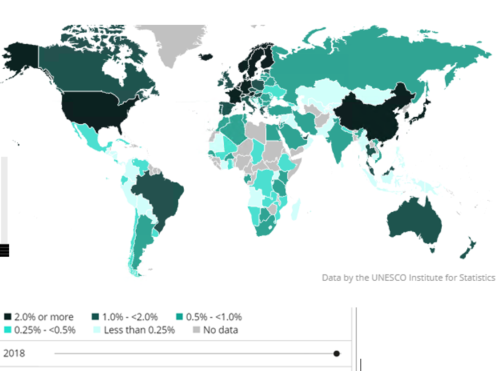
The regional situation regarding the indicator ‘Researchers (in full-time equivalent) per million inhabitants’ also shows a wide disparity across the region, following a similar pattern to that of the trend in R&D expenditure given that a large proportion of R&D expenditure is allocated to the wages and salaries of researchers. Globally, the number of researchers per million inhabitants stands at 1,198 (in 2017). Europe & Northern America have an above world average with 3,707 researchers per million inhabitants, while it is as low as 99 in sub-Saharan Africa. The other regions stand at: Eastern & South-Eastern Asia (1,468), Northern Africa & Western Asia (854), Latin America & the Caribbean (515), and Central & Southern Asia (287). Figures 4 illustrates the worldwide distribution of researchers in relation to total population of countries are considered (per million), for 2018 or latest year available.
Figure 4. Researchers (in full-time equivalent) per million inhabitants, latest year available

Worldwide, the percentage of female researchers (based on headcounts) is only about 30% of total researchers (in 2017). Latin America & the Caribbean have the highest share of female researchers, at 45.8% followed by Northern Africa & Western Asia (38.0%). Around one in three researchers is female in Europe & Northern America (34.8%) and sub-Saharan Africa (31.0%). In contrast, the share of women researchers falls to 24.9% and 24.3% in Eastern & South-Eastern Asia and Central & Southern Asia respectively, being the lowest among the regions.
However, there are some exceptions at the country level when female participation in R&D is considered. Only about one in four countries have achieved gender parity (defined as a share of between 45% and 55% for either sex) out of 149 countries with available data (for 2018 or latest year available). On the other hand, female researchers outnumber men in: Argentina, Armenia, Azerbaijan, Georgia, Kazakhstan, Kuwait, Latvia, Myanmar, New Zealand, Panama, Philippines, Serbia, North Macedonia, Trinidad and Tobago, Tunisia and Venezuela.
Data are also available for a wide range of other R&D indicators and variables, such as R&D expenditure disaggregated by sector of performance, source of funds, field of R&D, type of costs and type of R&D. Also included are data on researchers broken down by sex, level of qualifications, field of R&D as well as data on researchers by age groups and seniority grades.
The new data are based on the UIS 2019 R&D Statistics Survey as well as statistics obtained from UIS partners, notably the Organisation for Economic Co-operation and Development (OECD), the Statistical Office of the European Union (Eurostat) and the Ibero-American Network of Science and Technology Indicators (RICYT).
These data, including time series data, are available in the UIS database. They are also featured in the United Nations Statistics Division’s (UNSD) SDG indicator database as well as in numerous indices, databases and reports including the UIS R&D Fact Sheets.